Advertisement
Working with data today is not just about collecting and displaying numbers. To make data truly useful, you need ways to model it, ask meaningful questions, and extract clear answers. Power BI, Microsoft's analytics tool, helps people do this through interactive dashboards and reports. One feature that often feels complex to beginners, yet is central to its capabilities, is DAX. DAX, or Data Analysis Expressions, is a formula language that lets you build custom calculations and dynamic measures. Understanding what DAX is and how to use it effectively allows you to create smarter, more responsive reports.
DAX, short for Data Analysis Expressions, is a formula language created for defining calculations in Power BI, Excel Power Pivot, and SQL Server Analysis Services. Unlike simple Excel formulas, DAX operates on the data model beneath the surface, letting you work with relationships, large datasets, and dynamic aggregations.

The main idea behind DAX is that it calculates results based on context. For example, a DAX measure for total sales will automatically adjust its result when filters for region, date, or product are applied in a report. This dynamic behavior comes from DAX’s understanding of row context and filter context — two key ideas that determine how and where a formula applies.
Though DAX resembles Excel formulas in syntax, it is far more powerful. It offers special functions for working with relationships across tables, for calculating time-based comparisons like year-to-date or prior-year values, and for handling iterative logic efficiently, even across millions of rows. This flexibility is what makes DAX central to Power BI’s ability to create customized, interactive dashboards.
DAX gives you more control than the standard Power BI interface. With it, you can create calculations tailored to your needs without altering the raw data source. While Power BI can quickly sum or average a column, DAX lets you calculate weighted averages, running totals, or year-over-year changes with ease.
Performance is another benefit. Because DAX runs at the data model level, it avoids recalculating unnecessarily and keeps reports responsive, even with complex aggregations or large datasets. Its design works well with Power BI’s columnar storage and compression, making it more efficient than trying to process similar calculations in Excel.
Time-based analysis is simplified with DAX’s time intelligence functions. You can calculate things like cumulative quarterly sales or compare current and previous year performance without needing to restructure your data or write multiple queries. These built-in date functions save time and reduce errors in analysis.
Finally, DAX supports good data modeling practices. Instead of changing raw data, you can add calculated columns and measures within your model, keeping the original data clean. This separation makes dashboards easier to maintain and update, even as your datasets evolve or as new reporting needs arise.
Starting with DAX in Power BI can feel a little daunting, but breaking it into steps makes it more manageable. Once your data is loaded into Power BI and your table relationships are set, you’re ready to write calculations using DAX.
First, decide whether you need a calculated column or a measure. Calculated columns add a new column to your table, giving each row a value based on your formula. For example, you could add a column that labels each sale as “High” or “Low” depending on the amount. Measures, on the other hand, don’t exist at the row level. Instead, they compute values dynamically, adjusting to the filters applied on a page or visual. An example is a measure that sums sales amounts filtered by the current selection.
To create a calculated column, go to the data view, select your table, and click “New Column.” In the formula bar, write something like:
Category = IF(Sales[Amount] > 1000, "High", "Low")
This assigns a label to each row based on the sales amount.
For a measure, go to the data or model view and click “New Measure.” A simple example of a measure is:
Total Revenue = SUM(Sales[Amount])
This will dynamically show total sales, adjusting to any filters or slicers in your report.

As you advance, understanding row context and filter context becomes important. Row context refers to the current row when computing a column, while filter context refers to the filters in place when computing a measure. You can modify the filter context using functions like CALCULATE(), which lets you create more specific or conditional calculations.
DAX also makes working with time-based data much easier. Functions like SAMEPERIODLASTYEAR() or DATESYTD() help you create year-over-year comparisons, running totals, or fiscal-year summaries without complex manual work. Power BI usually generates a date table automatically, but you can create your own if you need more control.
When writing DAX formulas, keeping them simple and readable makes them easier to debug and maintain. Start with basic calculations and test them in your visuals. As you get more comfortable, you can combine functions to build more sophisticated logic. The formula bar offers helpful autocomplete suggestions and checks for errors as you type, which can guide you while you’re learning.
DAX in Power BI is much more than a formula language — it’s what makes your data models interactive, smart, and adaptable. Learning DAX lets you build calculations that respond to filters and adjust to context, uncovering more meaningful insights. Its ability to handle dynamic calculations, time-based analysis, and large datasets efficiently makes it a valuable skill for anyone building reports. By understanding the difference between columns and measures, practicing with context, and exploring the built-in date functions, you can create cleaner, more powerful dashboards. With DAX, you move beyond static reports to data that truly answers questions.
Advertisement
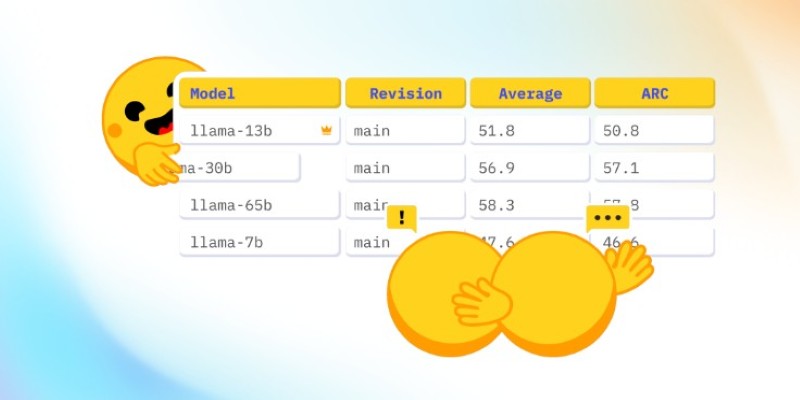
How CO₂ emissions and models performance intersect through data from the Open LLM Leaderboard. Learn how efficiency and sustainability influence modern AI development
What DAX in Power BI is, why it matters, and how to use it effectively. Discover its benefits and the steps to apply Power BI DAX functions for better data analysis

AI prompt engineering is becoming one of the most talked-about roles in tech. This guide explains what it is, what prompt engineers do, and whether it offers a stable AI career in today’s growing job market

How self-speculative decoding improves faster text generation by reducing latency and computational cost in language models without sacrificing accuracy

How inference providers on the Hub make AI deployment easier, faster, and more scalable. Discover services built to simplify model inference and boost performance

Discover 8 legitimate ways to make money using ChatGPT, from freelance writing to email marketing campaigns. Learn how to leverage AI to boost your income with these practical side gigs

What is the AI alignment control problem, and why does it matter? Learn how AI safety, machine learning ethics, and the future of superintelligent systems all depend on solving this growing issue
How a synthetic data generator can help you build training datasets using natural language. Speed up your AI development without writing code or using sensitive real-world data

Learn 8 effective prompting techniques to improve your ChatGPT re-sponses. From clarity to context, these methods help you get more accurate AI an-swers

Explore 5 real-world ways students are using ChatGPT in school to study better, write smarter, and manage their time. Simple, helpful uses for daily learning

Start learning natural language processing (NLP) with easy steps, key tools, and beginner projects to build your skills fast

Is ChatGPT a threat to search engines, or is it simply changing how we look for answers? Explore how AI is reshaping online search behavior and what that means for traditional engines like Google and Bing